In a media landscape with seemingly endless formats to choose from, the creative use of visuals can give journalists an edge.
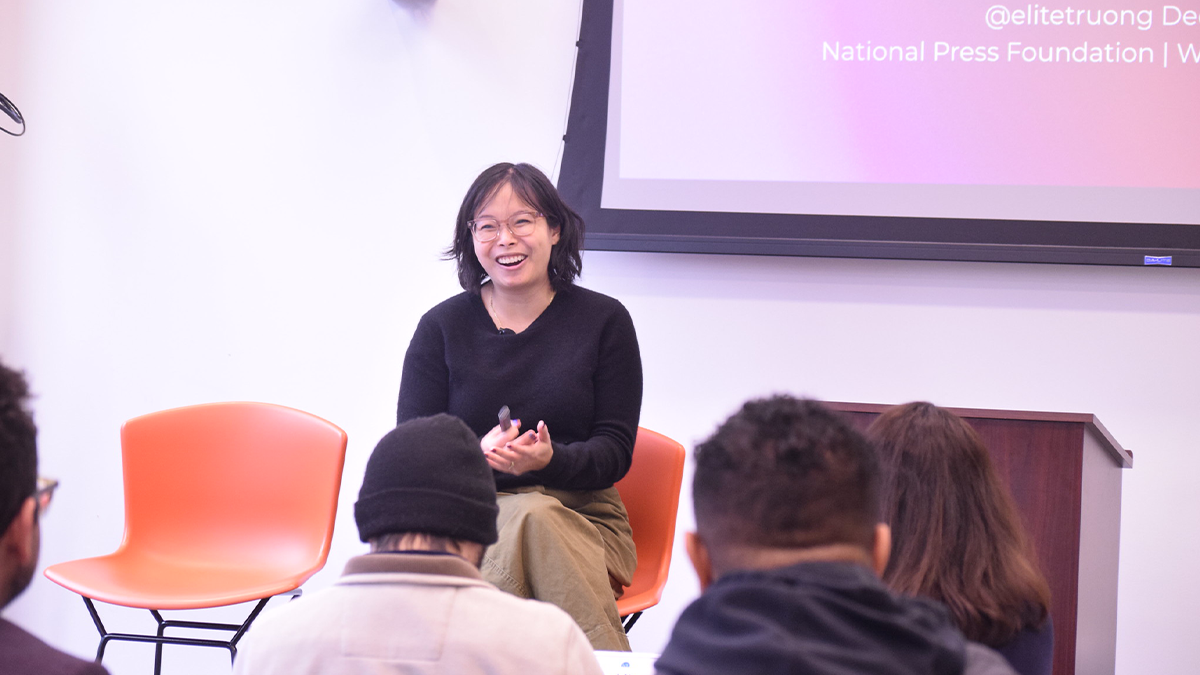
That was the message shared by Javier Zarracina, the head of graphics at The Washington Post, and Teresa Lo, a social media visuals producer at The Guardian, during their session with the National Press Foundation Widening the Pipeline fellows.
Zarracina said news organizations are adopting a more multidisciplinary approach to producing visuals by viewing graphics as much more than fun entertainment. Infographics and data visualizations are used to convey deep reporting that words alone simply cannot capture.
“When we create a visualization, we are thinking on a very specific function for that visualization, and it’s to convey information.”
Interactives require a diverse team from across the newsroom to bring to life.
“Graphics certainly is a work of collaboration and integration is very important,” Zarracina said.
Teams often consist of reporters, data scientists, 3D modelers, cartographers, and social media producers working together. They collaborate and perform forensic research to create visuals that don’t just support the article but replace the article format entirely.
Here are some highlights from the session:
Think Platform-Agnostic
The biggest mistake a journalist can make is assuming a story must always be a written 1,000-word article. Stories must be adapted to formats readers will want to engage with on their smartphones. Zarracina believes the best way to tell a story might actually be a social carousel or video. Future journalists should be prepared to adapt storytelling to fit different and smaller media.
The Social-First Feedback Loop
Lo emphasized that for social media, the rule is simple: the more visuals, the better. When reporters are out in the field, they should be collecting visuals of everything. All of these little visuals put together will allow social media teams to create digestible content that is easy to share.
“Very rarely is a social post just a 1:1 copy of what the story looks like on site. Sometimes it’s only pulling out one interview out of five that you have in a story to highlight on social. Sometimes it is just a specific list,” Lo said, encouraging reporters to talk with social media and design teams early and often.
Lo encourages newsrooms to establish feedback loops where social teams can show reporters the engagement that comes from social media. When a reporter sees how a specific visual helped their story go viral on Instagram, it changes the newsroom culture from text-heavy to visual-first.
Advice for the Future
Journalists do not have to be a master of 3D modeling or coding to boost their reporting with visuals and graphics. Zarracina’s advice to future journalists is to pick one tool and master it. Whether it’s organizing data in Excel, making a simple chart in Data Wrapper, or sketching on an iPad, having one visual skill makes you a much more valuable graphics reporter. And if you already have the data and visual skills, build your journalism and language chops.
Tools for visual journalists and graphic designers to learn:
Adobe Creative Cloud
Mapping
Dataviz
3D
Access the full transcript here.
This fellowship is funded by the Evelyn Y. Davis Foundation and the John C. and Ethel C. Eklund Scholarship Fund. NPF is solely responsible for the content.