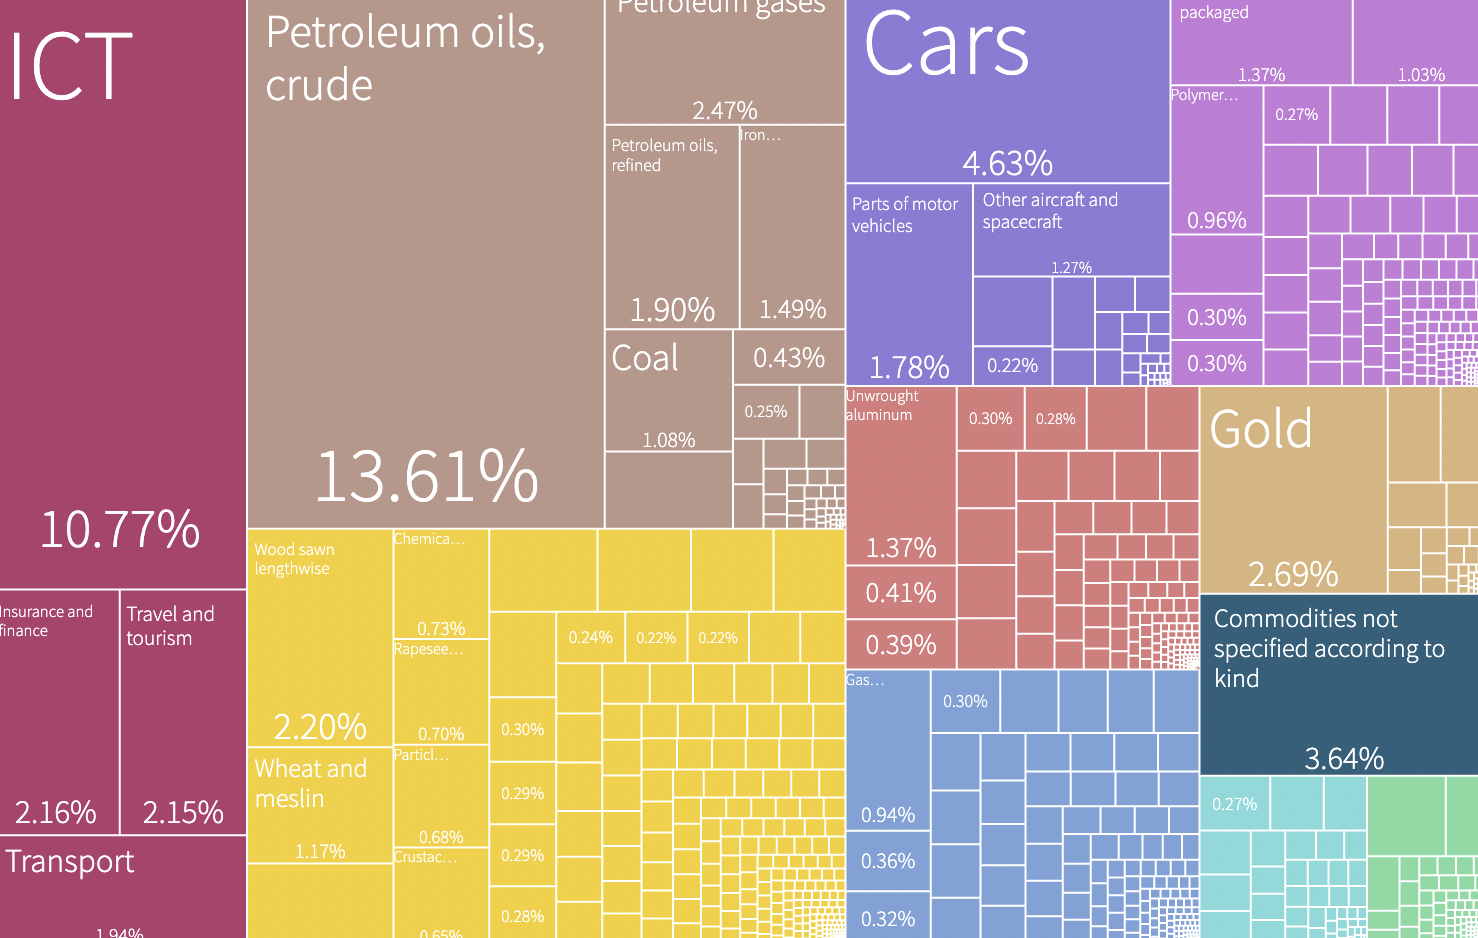
The Atlas of Economic Complexity allows reporters to produce data visualizations showing any country’s trends in imports and exports for 6,000 products and services.
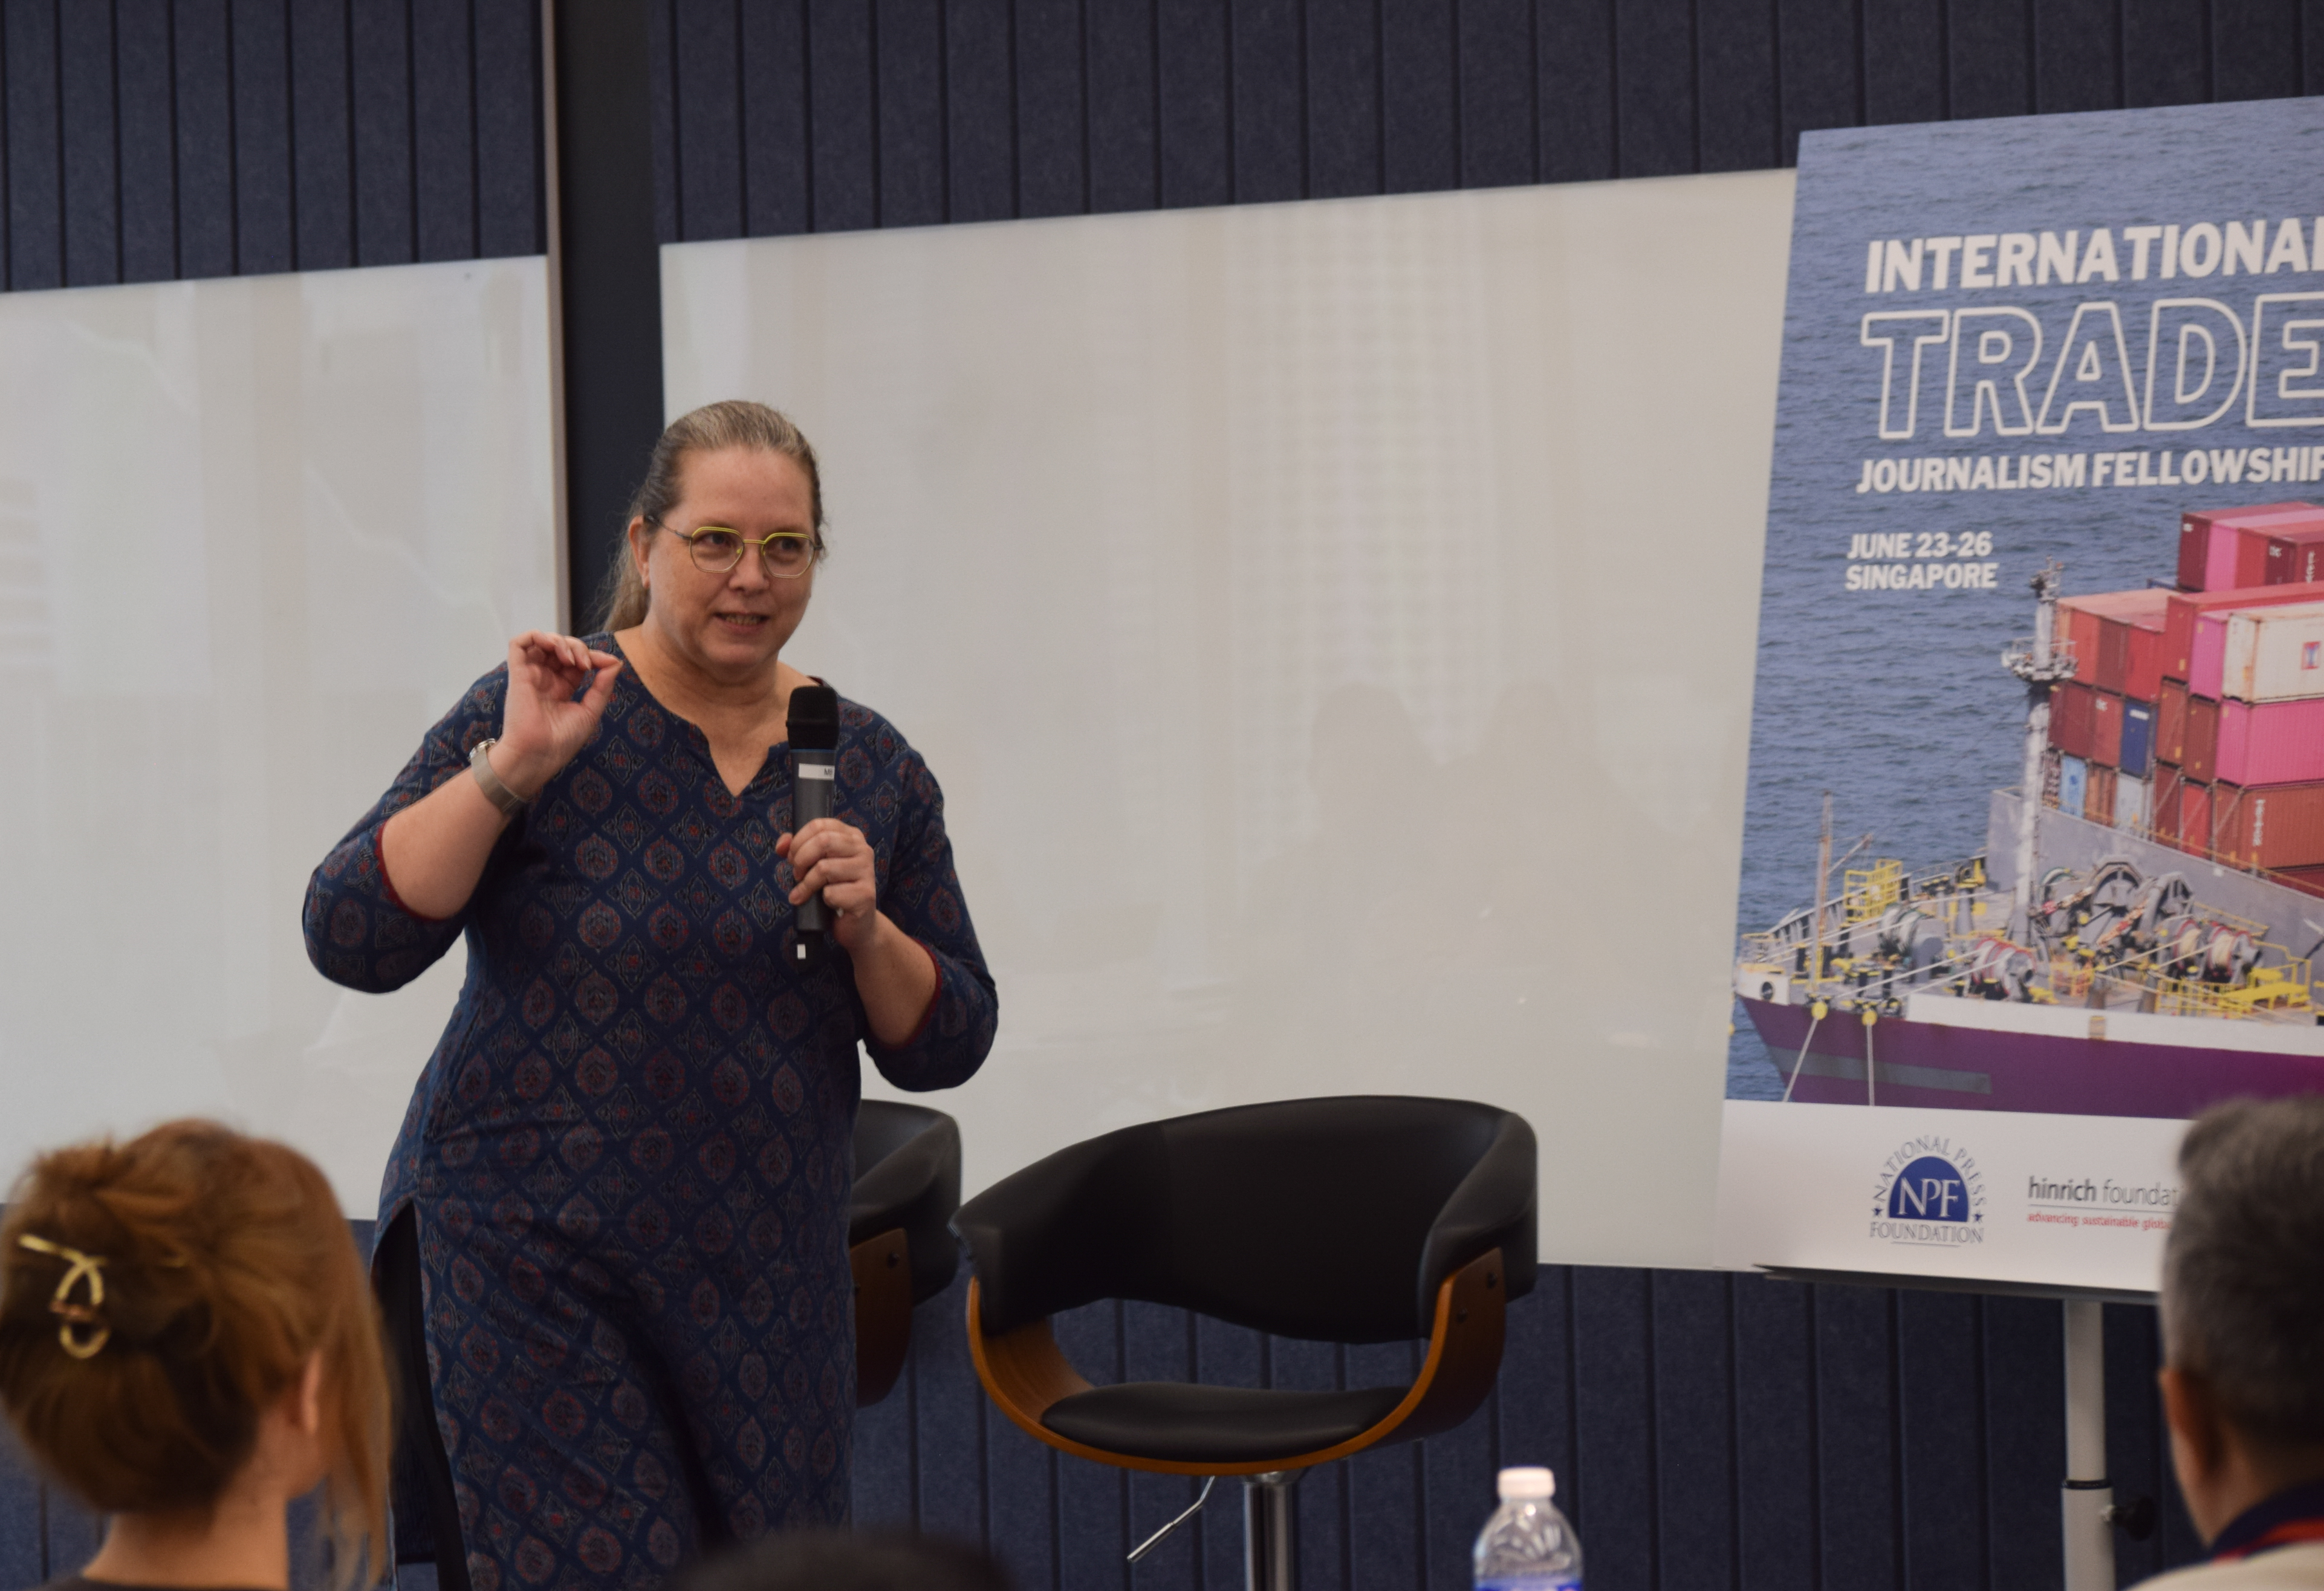
“Simply put, it’s a tool that helps us to understand economic opportunity and dynamics for every single country in the world,” Harvard Growth Lab’s director of software tools Annie White told NPF’s International Trade Fellows, alongside senior manager of applied research Tim Cheston.
The Atlas uses data from the UN’s Comtrade database, which collects nationally reported data semiannually. The Growth Lab adjusts the data to maximize reporting, making it possible to chart thousands of products and services, searchable by name or specific trade codes. The Atlas also shows the growth of industries in individual countries over multiple years, allowing for the comparison of certain countries against each other.
Q&A:
Is the data cross-checked or verified?
Cheston said that the export data comes from what is reported from the exporter and importer.
“So the most frequent feedback we always get is to say, ‘This does not reflect our national accounts.’ And we have to say, ‘This is what you reported to the UN Comtrade.’ And thankfully we clean it up by rectifying what the importer reported versus what the exporter reported, what the value is.”
He added that the Atlas is not a breaking news tool.
“Our focus on this site is to really compile comparative data for all of global trade to show that the know-how you have today predicts the diversification paths you have available to you – where diversification is the name of the game in terms of how a shared prosperity really is sustainable over time.”
For example, India is in the tool’s top 5 countries for predicted growth, “because it has greater complexity than its income level today,” Cheston said.
Within the product categories you also identify the number of production units, the number of companies that are participating in the individual product. For example, you may have a very large export of PCs to Vietnam, but only done by one company as opposed to multiple companies with which would be a more complex team process.
“In the Atlas we don’t account for firm level data … however, when we get to Metroverse, which is our city-based tool, we do,” said White.
Metroverse is a Harvard Growth Lab prototype of more localized economic data for 1,022 cities worldwide.
In this tool, “we’re not looking at products anymore, we’re looking at industries,” said White. “What’s amazing about this is it is represented by firm size, whether that’s by employees or based on establishment count.”
Is the complexity of the index really weighted to the countries with which you measure imports and exports as opposed to the size of the domestic income?
“We find that often some of your most complex exports are exported to your neighbors or exported actually to some low-complexity settings in which many either landlocked countries or others can actually afford a lower quality of product because it is so costly to send it to their landlocked neighbor,” said Cheston.
Do you open the public to query your data by API or REPL?
“We don’t have a public API for the Atlas. It could be coming down the road,” said White. “And some of the code is available as open source in our GitHub. But really the most access we give to users is downloading the data set entirely.”
Access the full transcript here.
White and Cheston briefed NPF International Fellows in 2023 on Harvard Growth Lab’s Atlas of Economic Complexity. Read the story here.
This fellowship is part of an ongoing program of journalism training and awards for trade coverage sponsored by the Hinrich Foundation. The National Press Foundation is solely responsible for the content. All programs are on the record and resources and transcripts from this and previous fellowships are published.