
5 takeaways:
➀ Climate change threatens the nation’s already crumbling infrastructure. McKinsey & Co. estimates that climate change could require average spending of $150 billion to $450 billion per year on infrastructure, worldwide, in 2050. Since the 1980s, the number, lives lost and total cost of various natural disasters has steadily increased, said Adie Tomer, a fellow in the Metropolitan Policy Program at the Brookings Institution. “Our storms just continue to grow fiercer, more frequent, and, critically, we continue to pay more in damage for them,” he said.
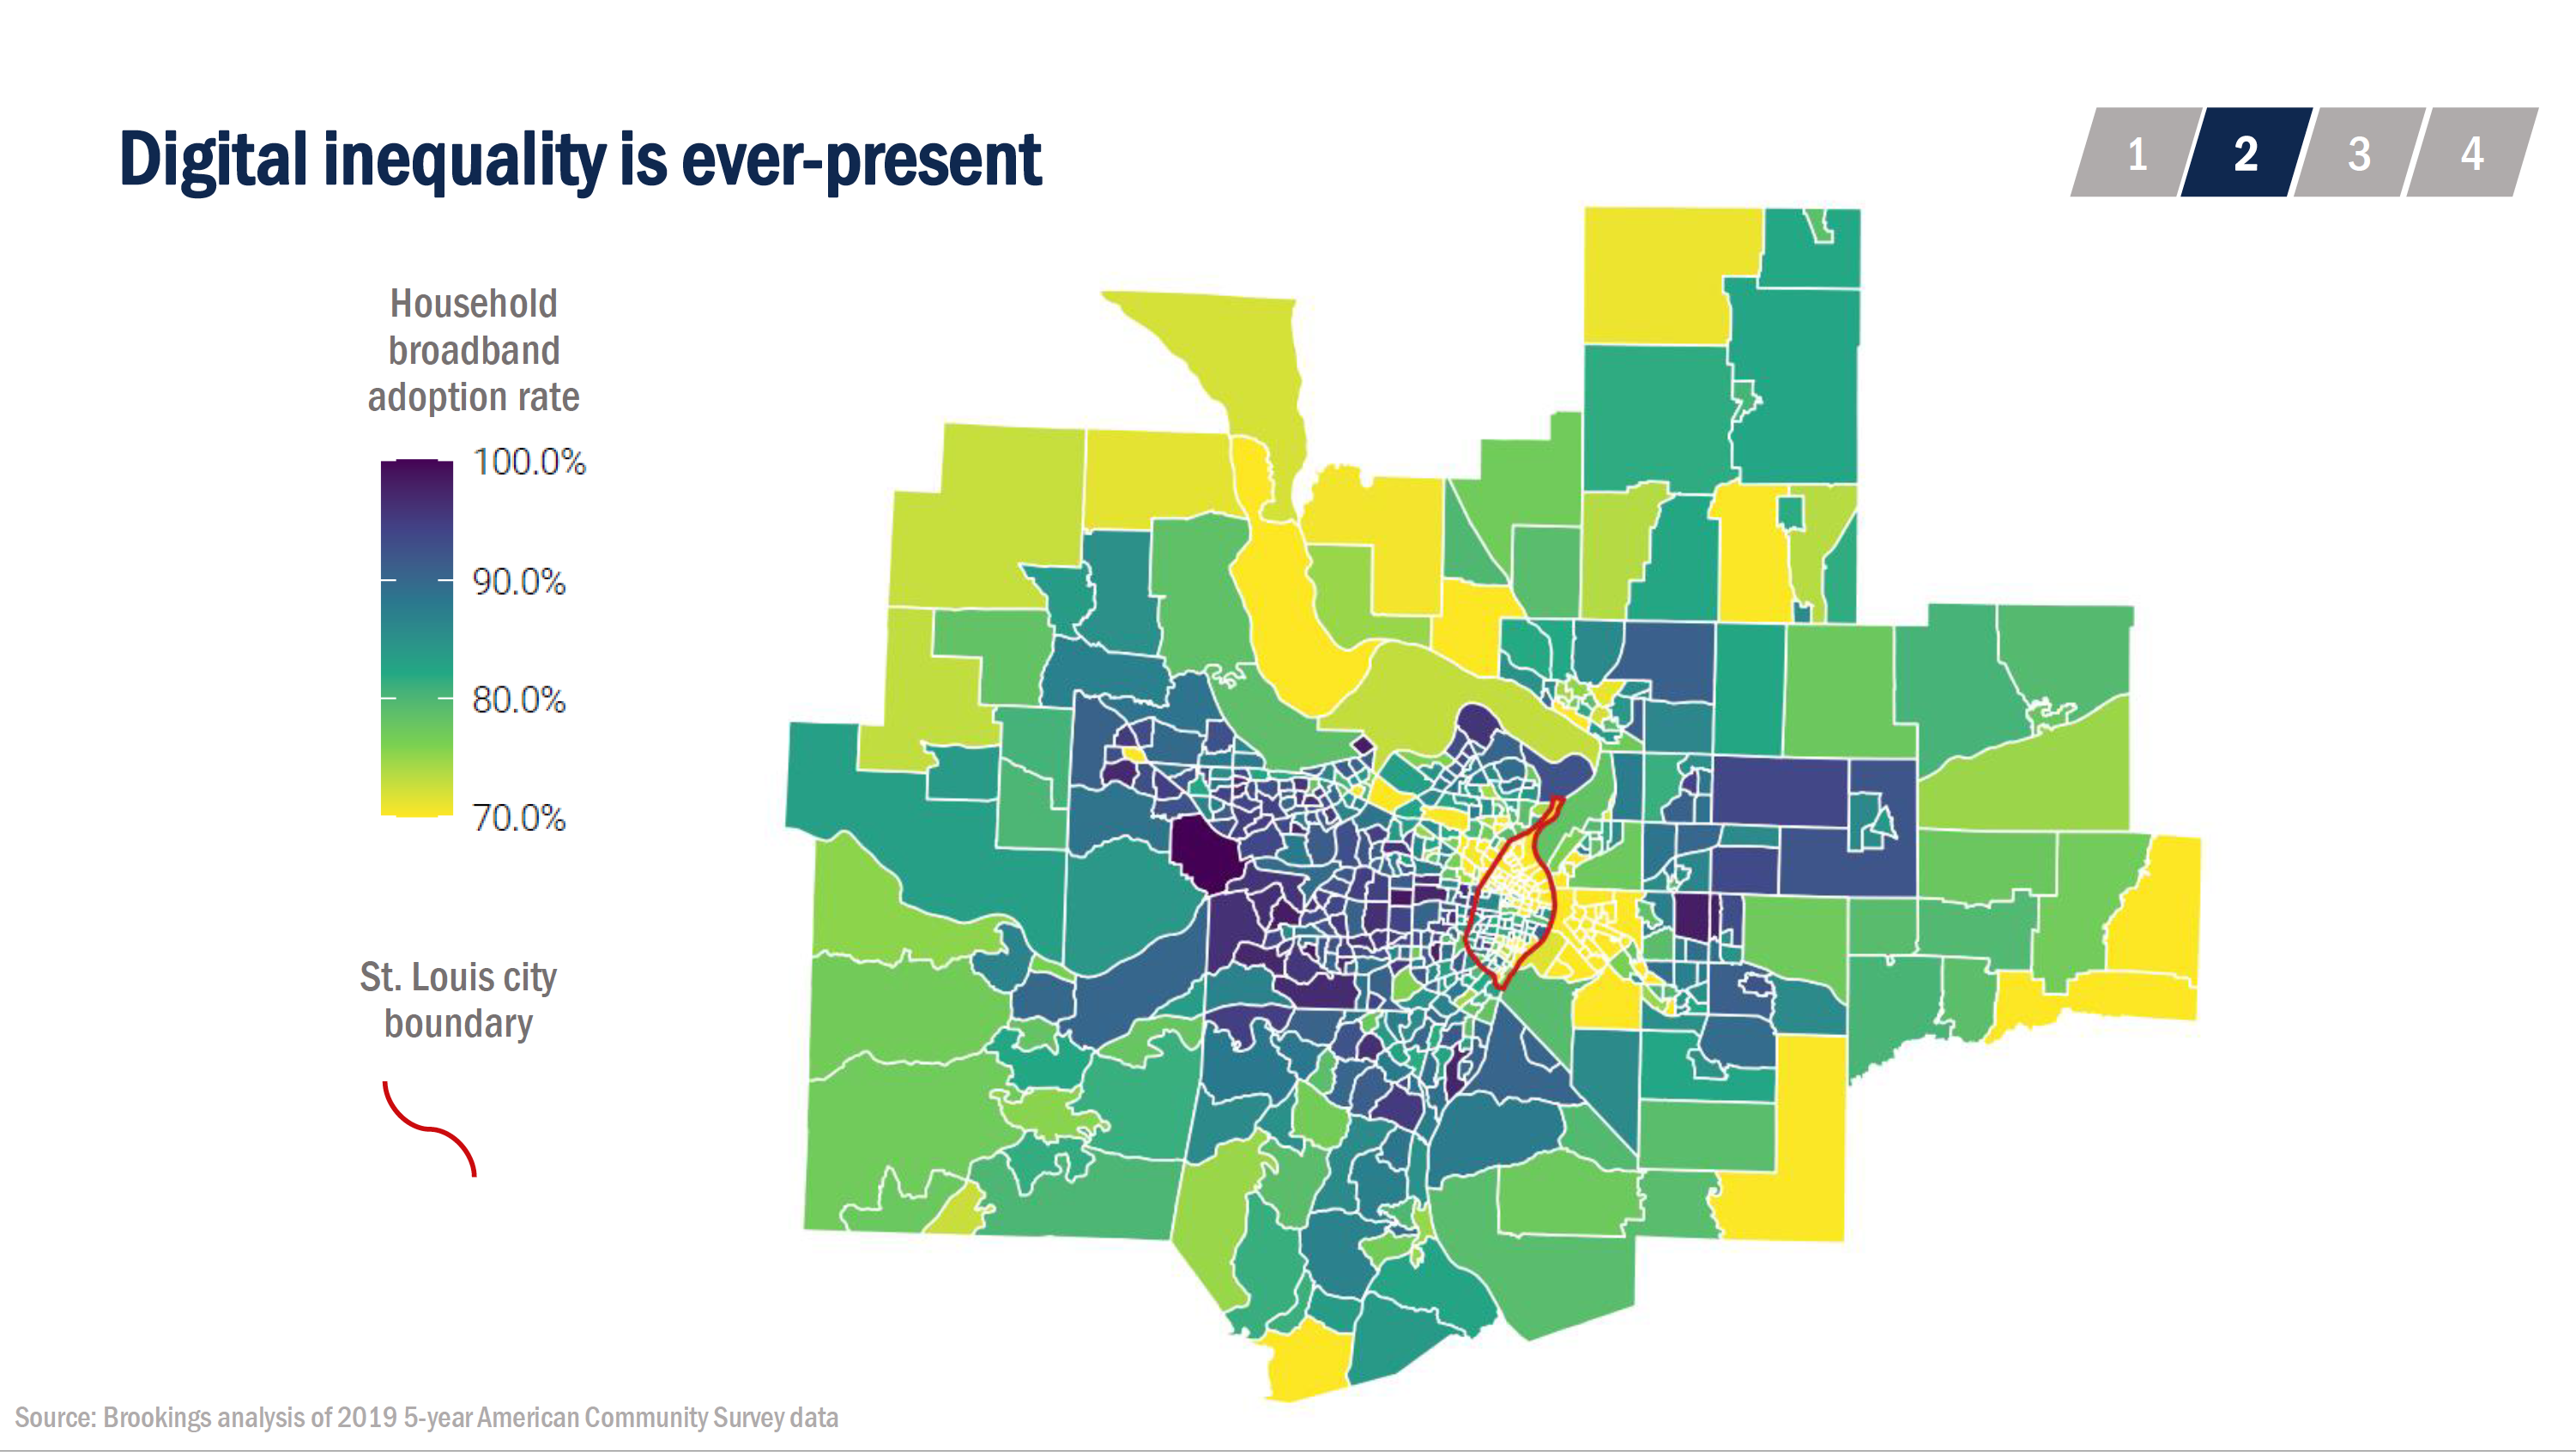
➁ Infrastructure beat reporters also need to cover digital infrastructure. In addition to roads, airports, dams, ports, water supply lines and wastewater facilities, journalists need to focus on 21st century communications architecture, including broadband, Tomer said. His map of the St. Louis metropolitan area shows large sections are only 70% covered by broadband while a majority of the area has 80%-100% coverage. “We are nowhere near the connection levels that we need,” he said. More than 35% of rural Americans also lack access to broadband. Reporters can find data on broadband coverage by area from the U.S. Census Bureau’s American Community Survey.
➂ The nation’s current infrastructure exacerbates income inequality. For the average American, the cost of infrastructure-related services — transportation, utilities, fuels and public services — consumes about 20% of the household budget. But for the poorest fifth of Americans, the figure is nearly half, according to a Brookings analysis of Bureau of Labor Statistics data. Throw in the cost of housing and the poorest Americans have used all their available money — and more. “Tens of millions of households are actually in the red every single month, just when you combine utilities, transportation and housing,” Tomer said. “And the second 20% of households after them — so we’re talking 40% in total — are really close to broke just by the built environment alone.” Policymakers need to explore both how to pay for infrastructure and also how it can be made more affordable, he said. (The infrastructure plan from President Joe Biden would tackle many of the priorities Tomer identifies; Republicans countered with their own proposal, and as of July 2021, the two sides were slogging it out in Congress.)
➃ Driver and pedestrian safety is a growing problem, and journalists should rethink how they report on it. Kelcie Ralph, an assistant professor at Rutgers University, said the dangers of pedestrians walking along the roads is often overlooked. Certain roadways are “essentially inhospitable to people walking or biking, and that’s fine — if you have a car,” she said. Over a 15-year period, one 20-mile stretch of U.S. Route 19 in Florida saw 137 people die after being hit by automobiles. But because such accidents happen one by one, they get little or no media coverage. Her research on distracted walking, pedestrian deaths and media coverage of them found that the media usually frame stories in a way that blames the pedestrian and not the drivers involved. “A pedestrian was hit” headline absolves the driver of responsibility and also changes the public’s perception of the safety of the roadways. Ralph suggested that reporters use active language — “A driver hit a pedestrian” — and that reporters explore the safety of the roadways as they are writing pedestrian-death stories. “It might include a description of the crash location. How many lanes are there? What’s the speed limit? Are there sidewalks?” she said. “… Our default coverage is one and done. Just a crash, and then we move on.”
➄ Reporters should also explore the safety and condition of the nation’s bridges and roadways. Traditional infrastructure reporting is fueled by using two important databases from divisions within the U.S. Department of Transportation: the National Bridge Inventory and the Road Conditions database. Mike Lindblom, who covers transportation for The Seattle Times, has used the databases to show what percentage of highways in his state are considered unacceptable — or so rough they cause cars to bounce up and down too much. The bridge inventory shows the condition of every bridge in the nation — his state of Washington, for example, has 8,338 — and can be used to help focus public attention on the riskiest ones. While the database is a bit wonky, Lindblom gave an overview of how to use it.
Speakers:
Adie Tomer, Fellow, Metropolitan Policy Program, Brookings Institution
Mike Lindblom, Transportation Reporter, The Seattle Times
Keith Laing, Automotive Regulations Reporter, Bloomberg News
Aileen Cho, Senior Editor, Transportation, Engineering News-Record
Kelcie Ralph, Assistant Professor, Rutgers University
This program, part of the Paul Miller Fellowship, was funded by the Walter and Karla Goldschmidt Foundation and other donations to the National Press Foundation, which is solely responsible for its content.


