Amid a wide range of brutal lessons learned during the era of COVID-19, one stands out.
“During the early reporting of COVID-19 in 2020, there were a lot of myths and rumors flying around through the spread of misinformation about what was happening in black communities,” said Candice Mays, project director for Mapping Black California. “There was the thing of ‘Black people couldn’t get COVID-19’ and because when they were looking at death rates for a while, our rates were lower. And so there was this idea that either we weren’t getting it, we weren’t being impacted or that we couldn’t die from it and spreading myths, dehumanizing us.”
Mays joined the June 2 Widening the Pipeline virtual training to explain how the lack of information about communities of color reveals a significant data “race problem.”
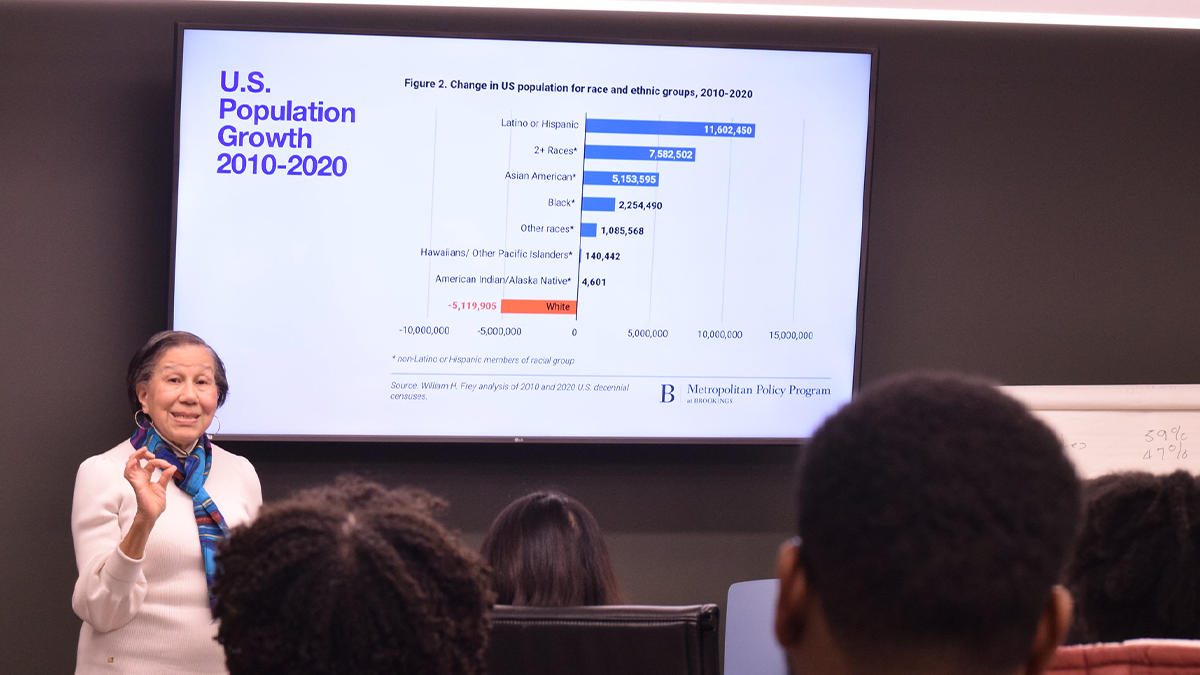
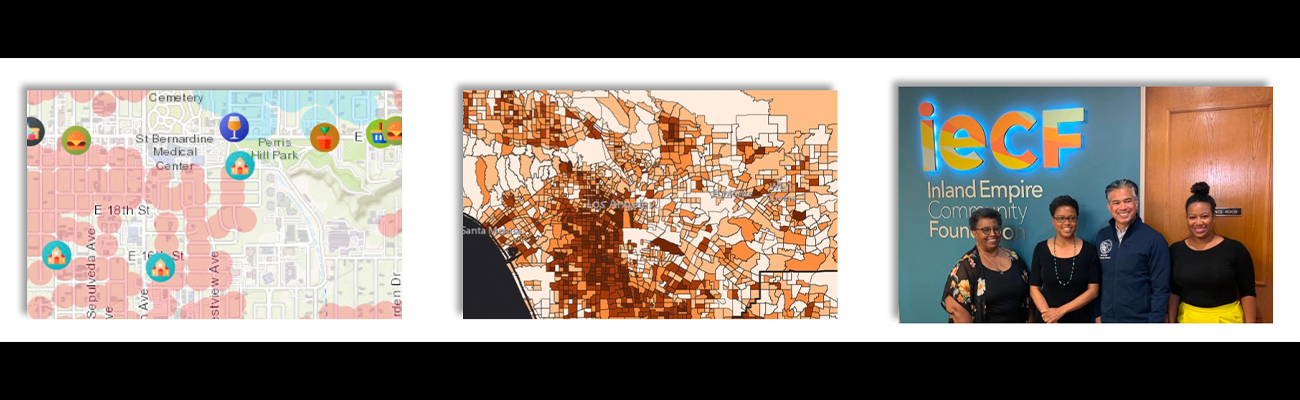
Mays said Mapping Black California, part of California’s Black Voice News organization, explores how the realities of Black communities are often misrepresented due to a lack of disaggregated data.
For example, for the 2020 Census, Mapping Black California had to develop its own maps and data sources to accurately identify hard-to-count Black populations as the state’s data was not disaggregated by race.
“And from that, our Black population count was more accurate than the national count,” Mays said.
In 2022, the state of California stopped publishing worker data disaggregated by race altogether. In a presentation seen by Attorney General Rob Bonta, Mays acknowledged the lack of data.
Eventually, that led to passage of California Assembly Bill 1604, chapter 313, making California the first state to mandate the breakdown of employee data by ethnicity, Mays said.
For journalists hoping to strengthen their storytelling through data, Mays advises a careful, nuanced approach.
“With data collection and validation, there are steps, right? The two parts are determining authority and understanding provenance. When you’re determining authorities, who are the leaders reporting around this topic, there are certain organizations you can’t leave out or it looks like your research wasn’t diligent. And if there is an organization you leave out, have a reason why. How long have they been publishing this data in the field of interest? Who financially supports their research and publications we know, especially from now who’s financing? It says a lot about what biases may be in that data or what intentions may be behind why that data is out there.”
Mays said mapping and data visualization can be powerful tools for storytelling, as well. She collected oral histories from Black residents of Moreno Valley, the area in which she grew up, to provide a more nuanced and authentic perspective on the community’s history.
“I’ve learned that there have been Black communities in the Inland Empire for over a hundred years, and that they’ve even founded some of the wealthier white communities with their work. And so it was really important to me to look into what was Moreno Valley’s story from the perspective of Black people.”
Access the full transcript here.
This fellowship is funded by the Evelyn Y. Davis Foundation. NPF is solely responsible for the content.